- Bitcoin prices firm above $8,500
- Technical analysts are overly bullish after Guppy indicator turned green
Bitcoin Price Analysis
Fundamentals
The excitement is palpable. However, traders ought to be practical. Trends don’t shift in short bursts. In different capital markets, it is normal for asset prices to cement their main trajectory after months or even years. As trends change, false breakouts and price consolidations are frequent. That is why, and as expected, one trader is wary of this BTC upswing.
According to a crypto trader, $11,700 is a crucial buy trigger that must be broken before bulls commandeer price action. Taking to Twitter, he said it is “ridiculous” for him to take a contrarian opinion. Nonetheless, it is wise to diverge from the mainstream stand. Even so, the trading community is confident that buyers are in firm control.Referring to a long-term technical indicator that turned green for the first time in three years, analysts are of the view that the crypto winter is finally over. The technical indicator, Guppy printed a buy signal. The last time it did, buyers pressed higher for two years.
Candlestick Arrangement

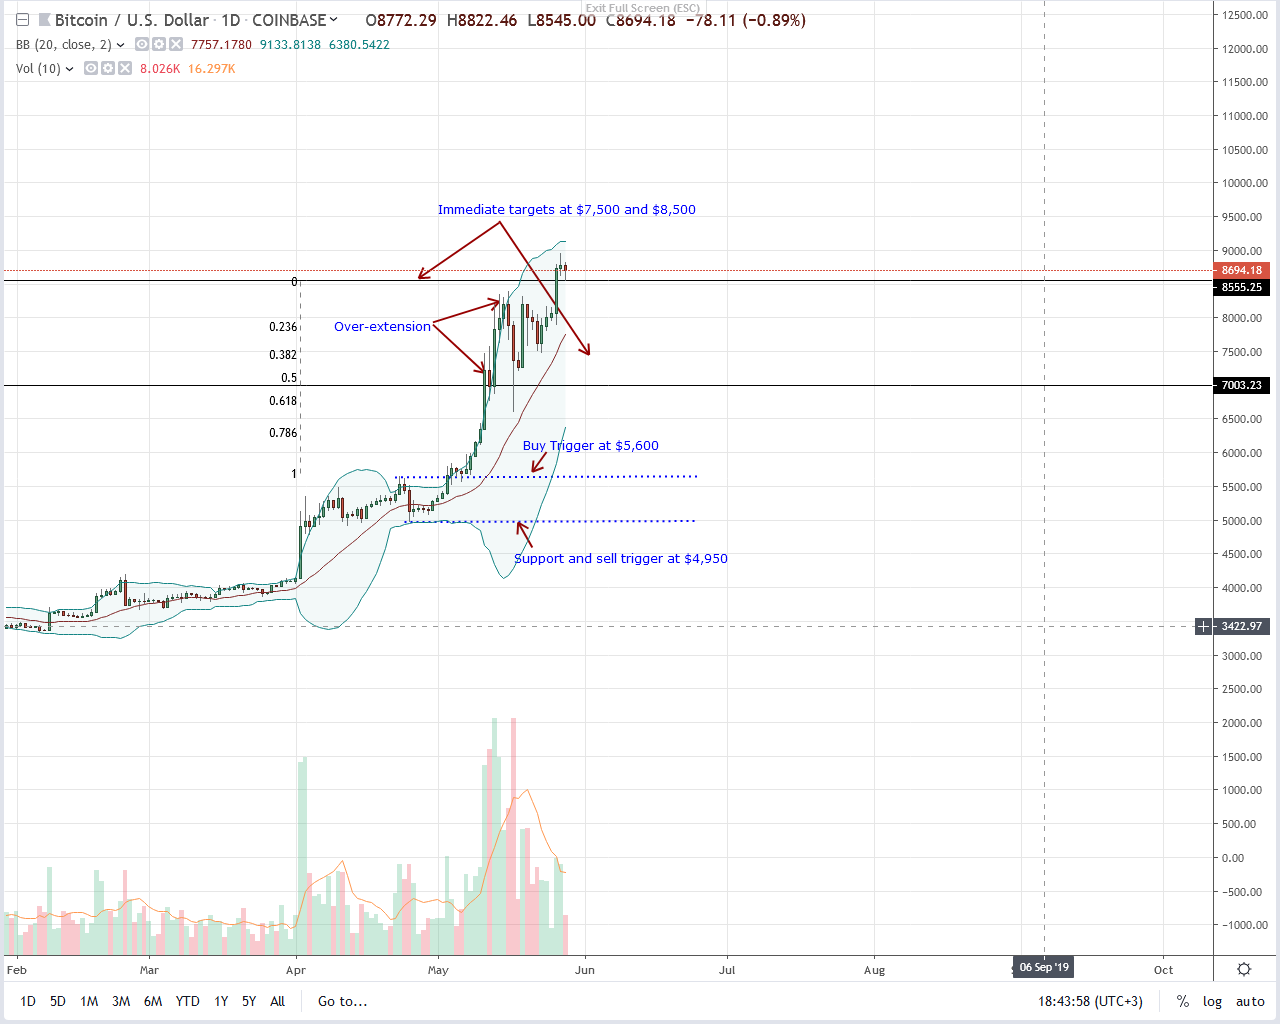
At the time of press, Bitcoin is changing hands at $8,685, stable in the past 24 hours but bullish, adding 8.9 percent week-to-date. From fundamental and sentiment analysis, it is clear that buyers are in control.
In line with our last BTC/USD trade plan, traders can fine-tune entries in smaller time frames, loading on dips with the first target at $10,000. It is easy to see why. From candlestick arrangements, BTC is within a bullish breakout pattern thanks to May 26th price spike that temporarily placed BTC at $9,000.
Since there is a confirmation—yesterday’s bar closed above $8,500, there is an opportunity to buy at spot rates with the target as aforementioned. However, we cannot discount a pullback towards the middle Bollinger Band (BB) — around $7,700, more so if accompanying trade volumes are high.
Technical Indicator
Since the trend is bullish, our anchor bar is May 26th bullish breakout bar. It has light trading volumes but is wide-ranging. As mentioned, traders are cautious of a pullback. Regardless, every low is a buying opportunity.
While it is true that buyers are in charge, it all depends on whether the bear bar erasing May 26th gains has high trading volumes above 19k or even 47k of May 14th. If that is the case, then traders should exit their long positions and wait for another buy signal.
0 Comments